Theatre Efficiency and Accuracy of Operating Time Estimation « Contents
Authors
Mr Thomas Collins Specialist Registrar, Trauma & Orthopaedics, Royal Bolton Hospital.
tomcollins761@gmail.com
Miss Elizabeth Pinder Consultant Orthopaedic Surgeon, Ipswich Hospital.
epinder@doctors.org.uk
Miss Laura Brennan (Medical Student, Norwich Medical School)|
l.j.brennan94@gmail.com . Mobile Number: 07870669549
Miss Claire Edwards Consultant Orthopaedic Surgeon, Norfolk and Norwich University Hospital
CLAIRE.EDWARDS@nnuh.nhs.uk
Keywords: Efficiency, operating times, day case, theatre optimisation.
Abstract
Introduction Increasing patient numbers causes greater need for theatre efficiency. This paper aims to assess the accuracy of predicted operation times and list finish times within a day surgery unit, implement changes to improve these accuracies and re-evaluate the accuracies.
Method Anaesthetic start, surgical start and finish and list finish times compiled from a computer-based surgical scheduling and resource management software called ORSOS during two 4-month periods. Electronic clinic letters provided predicted surgical times.
Results 82 patients included in initial data collection. 51.9% of lists ended within 30 minutes of the scheduled finish. 64.4% of operations had a predicted time within 20 minutes. 34.2% finished >20 minutes earlier. 1.4% finished >20 minutes later. Average discrepancy of predicted surgical time was a 17.1-minute over-estimation. Average anaesthetic time was 21 minutes. Therefore, average anaesthetic time was added to predicted procedure time and predicted surgical times were reduced 10 minutes. 86 patients included in repeat data collection. 52.4% of lists ended within 30 minutes of the scheduled finish. 43.2% of operations had a predicted time within 20 minutes. 44.6% finished >20 minutes earlier. 12.2% finished >20 minutes later. Chi-square analysis of list finish times between data collections yielded a p-value>0.05.
Discussion Repeat data collection showed accuracy of list finish times had no statistically significant improvement, individual procedures were over- and under-estimated more evenly, as were list finish times, possibly due to variation in case complexity between lists.
Conclusion Consider anaesthetic times individually. Appropriate case mixes scheduled from longest to shortest should be implemented.
Background
Over the past decade there has been a 40% increase in the number of procedures performed within the NHS (1). Optimising theatre lists is, therefore, of great importance with regards to reducing patient waiting times for elective procedures, improving the patient journey and maximising Trust resources.
Theatre efficiency is influenced by numerous factors, many of which have had improvements described in the literature through a variety of methods. For example, employing specific case scheduling policies (2) with the aim of minimising over- and underutilised theatre time, the use of electronic displays with evidence based recommendations (3) to aid decision making with list planning, employing an operating room (OR) manager or OR charter (4) to reduce first case start tardiness, planning anaesthetic assignments and OR choice prior to the list (5) and implementation of structured interventions(6) immediately prior to starting the list to reduce patient turnaround time.
The common denominator that these interventions rely on to be effective is accurate estimation of operating time. The purpose of this study is to determine if improving estimation of operating time can increase theatre efficiency through improved operation scheduling and optimisation of total list time. Our objectives are 1) assess the accuracy of predicted individual operation times and operating list finish times within the hand surgery day case unit at Norfolk and Norwich Hospital, 2) implement changes to improve accuracy of predicted individual operation times and list finish times, 3) evaluate if our changes have improved accuracy of predicted individual operation times and operating list finish times.
Methods
Anaesthetic start times, surgical start and finish times and operating list finish times were compiled from a computer-based surgical scheduling and resource management software called ORSOS for all elective hand lists at Norfolk and Norwich University Hospital. Our initial data collection took place between 13th October 2013 – 31st January 2014 and repeat data collection between 6th November 2014 – 27th February 2015. Predicted individual operative times were acquired from dictated clinic letters by surgeons estimating the surgical time following review of each patient. These predicted times were used to plan lists for all surgeons. Clinic letters were stored electronically on a theatre management system called BluespierTMS. The accuracies of predicted individual operation times were calculated by subtracting predicted operation time from actual operation time. “Operation time” was defined as surgical start time to surgical finish time. The list start time was taken as when the first case was sent for (complied from ORSOS). The finish time of each list was taken as the surgical finish time of the final case. This data was audited against the following standards that we felt represented a good level of accuracy 1.) >80% of operating lists finishing within 30 minutes of the scheduled finish time and 2.) >80% of individual operations having an actual operation time within 20 minutes of the predicted operation time. Anaesthetic time was calculated by subtracting the anaesthetic start time from the surgical start time.
Results I
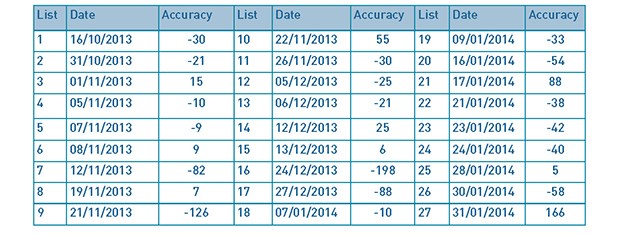
82 patients had operations on 27 operating lists. 51% were female. The age range was 11 – 85 years. The mean early list finish time was 50.1 minutes. This was calculated by averaging all the lists with a negative value shown in graph 1 and table 1. The mean late list finish time was 41.8 minutes. This was calculated by averaging all the lists with a positive value shown in Graph 1 and Table 1.
Graph 1: Individual list finish times
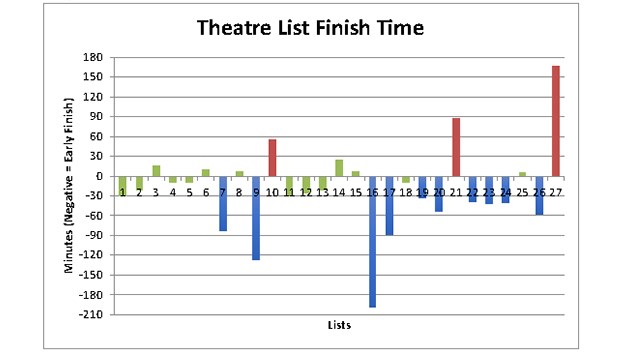
Graph 1 shows the number of minutes each list finished earlier or later than the scheduled finish time. The individual bars represent the number of minutes each list finished early or late. Bars that are negative on the y-axis denote lists that finished early, positive bars denote late finishes. Green bars indicate the lists that finished on time, blue bars represent early finishes and red bars denote late finishes (as described in table 2). The numbers along the x-axis correspond to a list number with the date specified in table 1 along with the numerical value of the bars.
Table 1: List dates and finishing time accuracy.
With regards to our first standard, the percentage of operating lists finishing within 30 minutes of the scheduled finish times was 51.9% (as shown in Table 2). This falls below our standard of 80%.
Table 2: List finishing time outcomes.

Table 2 summarises the number and percentage of the 27 theatre lists that finished early, on time or late (between October 13th 2013 – January 31st 2014). Early, on time and late finishes were any list with any accuracy of <-30, -30 - 30 and >30 minutes from the target finish time respectively.
Predicted individual operation times were documented in all but 9 of the 82 cases. Of the remaining 73 cases, 47 had a predicted individual operation time within 20 minutes of the actual procedure time (64.4%) as described in our second standard. 25 cases (34.2%) finished more than 20 minutes earlier than predicted and 1 case (1.4%) finished more than 20 minutes later than predicted. These results are shown in Tables 3 and 4.
Tables 3 and 4: Accuracy of predicted procedure times for individual cases
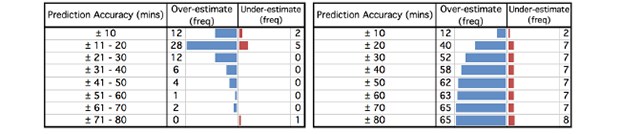
Table 3 [left] shows the frequency of cases that either finished earlier (over-estimated) or later (under-estimated) than the predicted operation time. The cases have been split into +/- 10 minute intervals. Table 4 [right] shows the cumulative frequency of all 73 cases with a predicted operation time across increasing +/- 10 minute intervals. The results can be visualised in the funnel plots accompanying each table.
Anaesthetic times were calculated for all but 3 of the 82 cases. Analysis of this data revealed an average anaesthetic time of 21 minutes.
Our results show that for individual operations there is a tendency to over-estimate the predicted individual operation time. This can clearly be seen by the significant skew of the funnel plot in table 4. The average discrepancy in predicted individual surgical time for the 73 cases was an over-estimation (early finish) of 17.1 minutes.
Following analysis of our initial data collection, there were two changes to our operating list planning strategy that we decided to implement in order to improve accuracy of predicted individual operation time, which in theory would lead to improvement in operation list finish times and optimisation of total list time. Firstly, “operation time” was re-defined to include the average anaesthetic time of 21 minutes (calculated from our initial data collection) in addition to surgical time. Secondly, having regularly over-estimated surgical time for all but 8 of the 73 cases (averaging 17.1 minutes), we reduced our predicted individual surgical times by 10 minutes per case. Therefore, with the combination of these two changes we felt an addition of 10 minutes to the predicted individual operation time for each case was a more appropriate way of planning our operating lists to improve efficiency.
Results II
Within the repeat data collection 86 patients had operations on 21 lists. 54.7% were female. The age range was 12 – 87 years. Graph 2 and table 5 show the number of minutes early or late each list finished in relation to the target finish time (described in our first standard). The mean early list finish time was 48.4 minutes, while the mean late list finish time was 49.3 minutes.
Graph 2: Theatre list finish times in minutes.
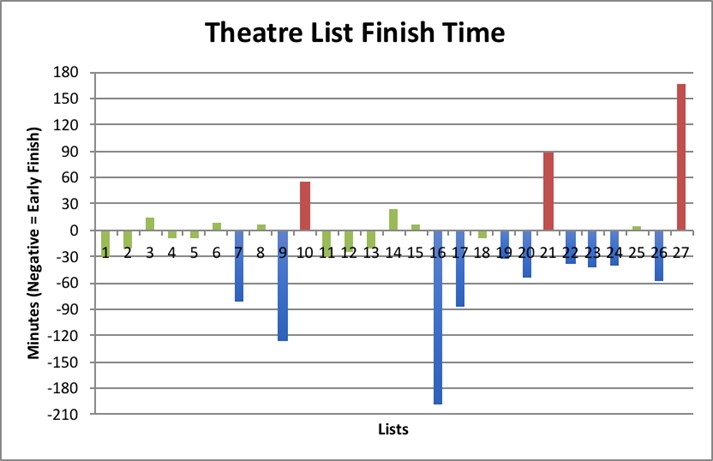
Graph 2 shows the number of minutes each list finished earlier or later than the scheduled finish time in the repeat data collection. The individual bars represent the number of minutes each list finished early or late. Bars that are negative on the y-axis denote lists that finished early, positive bars denote late finishes. Green bars indicate the list finished on time, blue bars represent early finishes and red bars denote late finishes. The numbers along the x-axis correspond to a list number with the date specified in Table 5 along with the numerical value of the bars
Table 5: List dates and finishing time accuracy.
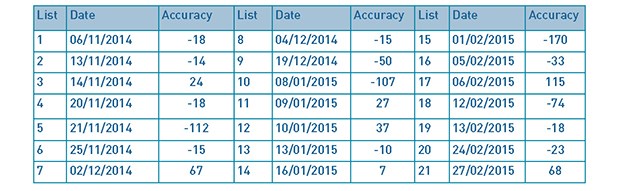
Table 6; Comparison of list finishing time outcomes.

Table 6 compares the initial audit and re-audit with regards to the number and percentage of the theatre lists that finished early, on time or late. There were 27 lists in the initial audit and 21 in the re-audit (from 6th November 2014 to 27th February 2015).
Predicted individual operation times were recorded for all but 12 of the 86 cases. Tables 7 and 8 show that from the remaining 74 cases, 32 had a predicted individual operation time within 20 minutes of the actual individual operation time (43.2%). 33 cases (44.6%) finished more than 20 minutes earlier than predicted and 9 cases (12.2%) finished more than 20 minutes later than predicted.
Tables 7 and 8: Accuracy of predicted individual operation times for repeat data collection.
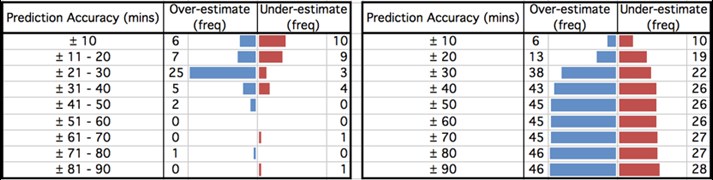
Table 7 [left] shows the frequency of cases that either finished earlier (over-estimated) or later (under-estimated) than the predicted operation time. The cases have been split into +/- 10 minute intervals. Table 8 [right] shows the cumulative frequency of all 74 cases with a predicted operation time across increasing +/- 10 minute intervals. The results can be visualised in the funnel plots accompanying each table.
The results from our repeat data collection show that there is a much more even distribution between over- and under-estimated individual operation times, as can be visualised in Table 8. This is reflected in the decrease in average discrepancy of predicted individual operation time from 17.1 to 8.1 minutes over-estimation (early finish).
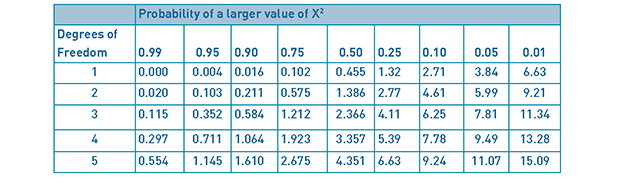
Table 6 shows the percentage of theatre lists finishing within 30 minutes of the target finish improved from 51.9% to 52.4%, remaining below our standard of 80%. A chi-square (Χ2) test assessing the difference in operation list finish times was performed with a null hypothesis (H0) of no difference in accuracy of operating list finish times between list planning strategies. This showed a Χ2(2) = 0.84 (see Table 9), with a corresponding p-value of 0.5<p<0.75. We set α<0.05, yielding a critical value (CRIT) of 5.99 (see Table 10). Χ2<CRIT, therefore, there is no statistically significant difference in the theatre list finishing times between the initial and repeat data collections. We must therefore accept our H0.
Table 9: Observed and expected values of operating list finish times.
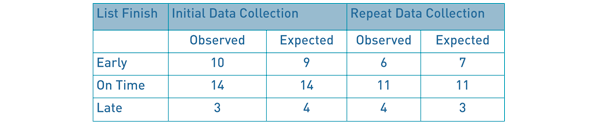
Table 9: Observed and expected values of operating list finish times. The expected values shown were calculated by multiplying the row and column totals of the observed values and dividing by the number of lists assessed across both data collections (48). Χ2 was then calculated using the formula Χ2 = Σ(Observed – Expected)2/Expected, to give 0.84 (2 decimal place). The p-value was then calculated at 2 degrees of freedom from a Χ2 distribution table (table 10) to be 0.5<p-value<0.75, and therefore not statistically significant.
Table 10: Chi-square Distributions.
Discussion
Theatre list finish times within 30 minutes of the scheduled finish time did not improve statistically, as shown by our Χ2 test. The mean early list finish time improved from 50.1 minutes to 48.4 minutes, however, the mean late list finish increased from 41.8 minutes to 49.3 minutes. Predicted individual operation times accurate to within 20 minutes of the actual operation time dropped from 64.4% to 43.2%. Predicted individual operation times over-estimated by more than 20 minutes increased from 34.2% to 44.6%, while predicted individual operation times under-estimated by more than 20 minutes also increased from 1.4% to 12.2%. The average anaesthetic time reduced from 21.0 minutes to 18.5 minutes, as did the average predicted operation accuracy from 17.1 to 8.1 minutes over-estimated.
Anaesthetic time was not incorporated within predicted individual operation time for our initial data collection because patients had differing co-morbidities that may have led to a different type of anaesthetic dependant on the anaesthetist covering each operating list. However, following our initial data collection it was clear from the number of over-estimated individual operation times that anaesthetic time needed to be included. The inclusion of anaesthetic time to the predicted individual operation time has had a noticeable effect on the percentage of cases that finish within 20 minutes of their predicted operation time. This is understandable considering the anaesthetic time varied greatly between simple and more complex surgeries, ranging from 0 to 84 minutes in our repeat data collection. Interestingly, the number of individual operations that were over- and under-estimated was much more evenly distributed in our repeat data collection (46 cases over-estimated, 28 cases under-estimated [see table 8]) compared with the initial data collection (65 cases over-estimated, 8 cases under-estimated [see table 4]). The percentage of lists finishing early dropped from 37.0% to 28.6%, while the percentage of lists finishing late increased from 11.0% to 19.1% [see table 6]. Again, this demonstrates that operating list finish times have become more evenly distributed between “early”, “on time” and “late” finishes. Both data collections showed that individual operation times were more likely to be over- rather than under-estimated, although, as previously mentioned this was much less pronounced in the repeat data collection. This may reflect the potential complexity of some cases requiring a more generous estimate. Alternatively, there may have been a requirement for intra-operative decision-making regarding the actual operation performed. Different surgical options will vary in predicted operative time; therefore, when planning operative lists, the longest estimation is most practical.
The greatest scope for improvement in our study is from more accurate planning of the anaesthetic time and appropriate case scheduling. Our allocated anaesthetic time was calculated by taking an average of all the individual cases from our initial data collection. However, a study by Dexter et al(5) described how the most effective means to minimise over- and underutilised theatre time is to liaise with the anaesthetic team. Naturally cases need to be booked onto a list months in advance, but discussing the list with the anaesthetic team within 2 days of the list allowed for any practical issues to be addressed, thereby reducing over-utilised theatre time.
Case scheduling plays an important role in maximising theatre time, especially when cancellations and rescheduling is performed within days of the operative list(7). Cognitive biases, such as risk adverse behaviour, are common amongst those who plan operative lists and has been shown to increase over-utilised theatre time(8). Current evidence shows that the best scheduling policy for reducing over-utilised time is where cases are scheduled from longest to shortest(2), in comparison our lists often had longer cases in the middle or at the end of the list.
There are some limitations to this study. Firstly, the causes for completing an operation earlier or later than expected were not identified and it is possible that unavoidable events may have occurred which could skew the results. We did not assess case mix and variations in complexity between the initial and repeat data collections. Shorter operations are more likely to finish within 20 minutes of their predicted operative time, therefore, a favourable case mix increases the possibility of achieving our standards. First surgeon grade for each case was not assessed either and it is reasonable to assume, for example, that a Consultant may perform certain procedures in a shorter time than a Registrar. Difference in operative time between surgeon grades would also be affected by the complexity of the procedure. For example, a greater difference in surgical time would likely be observed in complex cases as opposed to simple cases. On reflection, measuring surgical times for individual surgeons and operations would be the best way of accurately predicting surgical time.
Conclusions
Using standard surgical times to estimate operation time provides a good foundation for list planning, however, our study has shown that to optimise theatre time the anaesthetic time needs to be considered. This is challenging and ideally should be done on an individual basis with anaesthetic colleagues, but when achieved improved theatre efficiency can be seen through reduction of underutilised theatre time in our repeat data collection. Further studies looking into the variables affecting anaesthetic time, such as type of anaesthetic and patient co-morbidities, may be beneficial in creating a more accurate predicted anaesthetic time to use when list planning. Analysis of surgical times for individual surgeons and operations would be the best way of accurately predicting surgical time.
We recognise that when creating a list some flexibility is required, particularly for complex cases in which time pressures of a potentially overbooked list can be detrimental. However, estimating surgical times based on individual surgeons and specific operations, scheduling cases in descending time order and an appropriate case mix may hold the key to further reducing over- and underutilised theatre time, thereby improving theatre efficiency. The conclusions from this paper may help to inform future studies looking at strategies to optimise theatre utilisation. Further research into these strategies is required.
References
- Secondary Care Analysis Team, NHS Digital. Hospital Admitted Patient Care Activity, 2015-16 [Internet]. 2016 Nov. Available from: https://digital.nhs.uk/catalogue/PUB22378
- Shi P, Dexter F, Epstein RHM. Comparing Policies for Case Scheduling Within 1 Day of Surgery by Markov Chain Models. Anesthesia & Analgesia. 2016 Feb;122(2):526–38.
- Dexter F, Willemsen-Dunlap AC, Lee JD. Operating Room Managerial Decision-Making on the Day of Surgery With and Without Computer Recommendations and Status Displays. Anesthesia & Analgesia. 2007 Aug;105(2):419–29.
- Ernst C, Szczesny A, Soderstrom N, Siegmund F, Schleppers A. Success of Commonly Used Operating Room Management Tools in Reducing Tardiness of First Case of the Day Starts: Evidence from German Hospitals. Anesthesia & Analgesia. 2012 Sep;115(3):671–7.
- Dexter F, Shi PB, Epstein RHM. Descriptive Study of Case Scheduling and Cancellations Within 1 Week of the Day of Surgery. Anesthesia & Analgesia. 2012 Nov;115(5):1188–95.
- Soliman BAB, Stanton R, Sowter S, Rozen WM, Shahbaz S. Improving operating theatre efficiency: an intervention to significantly reduce changeover time. Journal of Surgery. 2013 Aug;83(7–8):545–8.
- Dexter F, Maxbauer T, Stout CM, Archbold LB, Epstein RHM. Relative Influence on Total Cancelled Operating Room Time from Patients Who Are Inpatients or Outpatients Preoperatively. Anesthesia & Analgesia. 2014 May;118(5):1072–80.
- Stepaniak PS, Mannaerts GHH, de Quelerij M, de Vries G. The Effect of the Operating Room Coordinator’s Risk Appreciation on Operating Room Efficiency. Anesthesia & Analgesia. 2009 Apr;108(4):1249–56.
Cite this article as https://daysurgeryuk.net/en/resources/journal-of-one-day-surgery/?u=/2018-journal/jods-284-december-2018/theatre-efficiency-and-accuracy-of-operating-time-estimation/
Download this article as PDF here: https://appconnect.daysurgeryuk.net/media/6046/284-collins.pdf